
PortsFish.Agency | Trade Intelligence & Data Lab
Predictive Pricing & Volatility Intelligence Layer
Price Index & Forecasting at PortsFish.Agency is a structured analytical framework designed to track, model, and forecast global seafood pricing dynamics across species, regions, corridors, and currency environments.
In international seafood trade, price volatility determines:
- Contract margin stability
- Payment risk exposure
- Inventory strategy
- Trade finance structuring
- Corridor competitiveness
- Capital allocation timing
PortsFish transforms price uncertainty into predictive intelligence.
Strategic Role Within the Ecosystem
The Price Index & Forecasting module integrates with:
- Supply–Demand Analytics
- Market Entry Programs
- Trade Finance & Letters of Credit
- Cross-Border Risk Management
- Investor Intelligence Reports
It provides forward-looking pricing visibility rather than historical reporting.
1. Global Species Price Index
PortsFish tracks structured benchmark pricing for:
- Tuna (fresh / frozen / canned grade)
- Shrimp (by size and origin)
- Salmon (farmed vs wild)
- Whitefish (cod, hake, pollock)
- Cephalopods (squid, octopus)
- Emerging premium species
Each index includes:
- Wholesale benchmark prices
- Import landing prices
- Regional retail averages
- Historical volatility bands
- Currency-adjusted comparatives
The index is updated on a rolling basis depending on market liquidity.
2. Regional Price Benchmarking
Pricing is segmented by:
- United States
- European Union
- GCC
- China
- Japan
- Southeast Asia
- Secondary growth markets
This enables exporters to detect:
- Premium pricing zones
- Price compression regions
- Arbitrage windows
- Cross-market margin discrepancies
3. Volatility & Risk Modeling
Price volatility is driven by:
- Supply shocks
- Climate events
- Fuel and freight costs
- Regulatory tightening
- Trade restrictions
- Currency fluctuations
PortsFish models:
- 12-month rolling volatility index
- Standard deviation bands
- Shock sensitivity modeling
- Corridor-specific volatility multipliers
Volatility intelligence directly informs:
- LC structuring
- Insurance thresholds
- Margin buffers
- Contract renegotiation clauses
4. Forecasting Engine
The Forecasting Layer combines:
- Historical time-series data
- Supply–Demand elasticity modeling
- Seasonality patterns
- Regulatory event projections
- Currency correlation matrices
- Freight & fuel cost overlays
Forecast windows include:
- Short-term (30–90 days)
- Medium-term (6 months)
- Annual projection (12 months)
Confidence intervals are displayed to indicate forecast reliability.
5. Scenario Modeling Lab
Investors and exporters can simulate scenarios such as:
- 20% fuel price increase
- EU quota reduction
- Sudden port congestion spike
- Currency devaluation event
- Regulatory tightening in IUU enforcement
- Climate-driven production disruption
The system recalculates:
- Price impact
- Margin compression risk
- Corridor attractiveness shifts
- Risk-Adjusted Opportunity Index (RAOI) changes
6. Margin Impact Dashboard
Price forecasting integrates with:
- Freight cost trends
- Insurance premiums
- Cold chain operational costs
- FX hedging exposure
- Import duty shifts
This provides:
- Net export margin outlook
- Corridor-level profitability forecast
- Risk-adjusted pricing recommendations
7. Investor & Bank View
For institutional users, the module provides:
- Volatility-adjusted corridor ranking
- Price stability score
- FX sensitivity heatmap
- Capital exposure alerts
- Structured commodity financing signals
Banks can use this intelligence to adjust:
- Spread pricing
- Collateral requirements
- LC confirmation thresholds
- Trade credit insurance mandates
8. Alerts & Early Warning Signals
The system generates alerts for:
- Price breakout beyond volatility band
- Rapid demand surge
- Supply compression signals
- Regulatory-driven scarcity
- Currency shock impact
- Corridor re-pricing shifts
Alerts can be delivered via:
- Dashboard notification
- Email brief
- Institutional bulletin
9. Integration with Risk & Finance Systems
Price Index & Forecasting feeds into:
- Customs Risk Scoring Model (CRSM)
- International Payment Risk Scoring Matrix (IPRSM)
- Cross-Border Risk Index (CBRI)
- Supply–Demand Analytics
- Investor Intelligence Reports
Pricing intelligence influences:
- Payment mechanism selection
- Contract length decisions
- Hedging strategies
- Corridor selection
- Working capital allocation
10. Strategic Outcome
Price Index & Forecasting transforms seafood pricing from reactive contract negotiation into predictive, risk-adjusted financial planning.
The objective is:
• Anticipate price movement
• Protect margins
• Reduce volatility exposure
• Optimize corridor strategy
• Strengthen negotiation power
• Align trade finance with pricing cycles
PortsFish does not simply report prices.
It models pricing behavior within structured global trade systems.
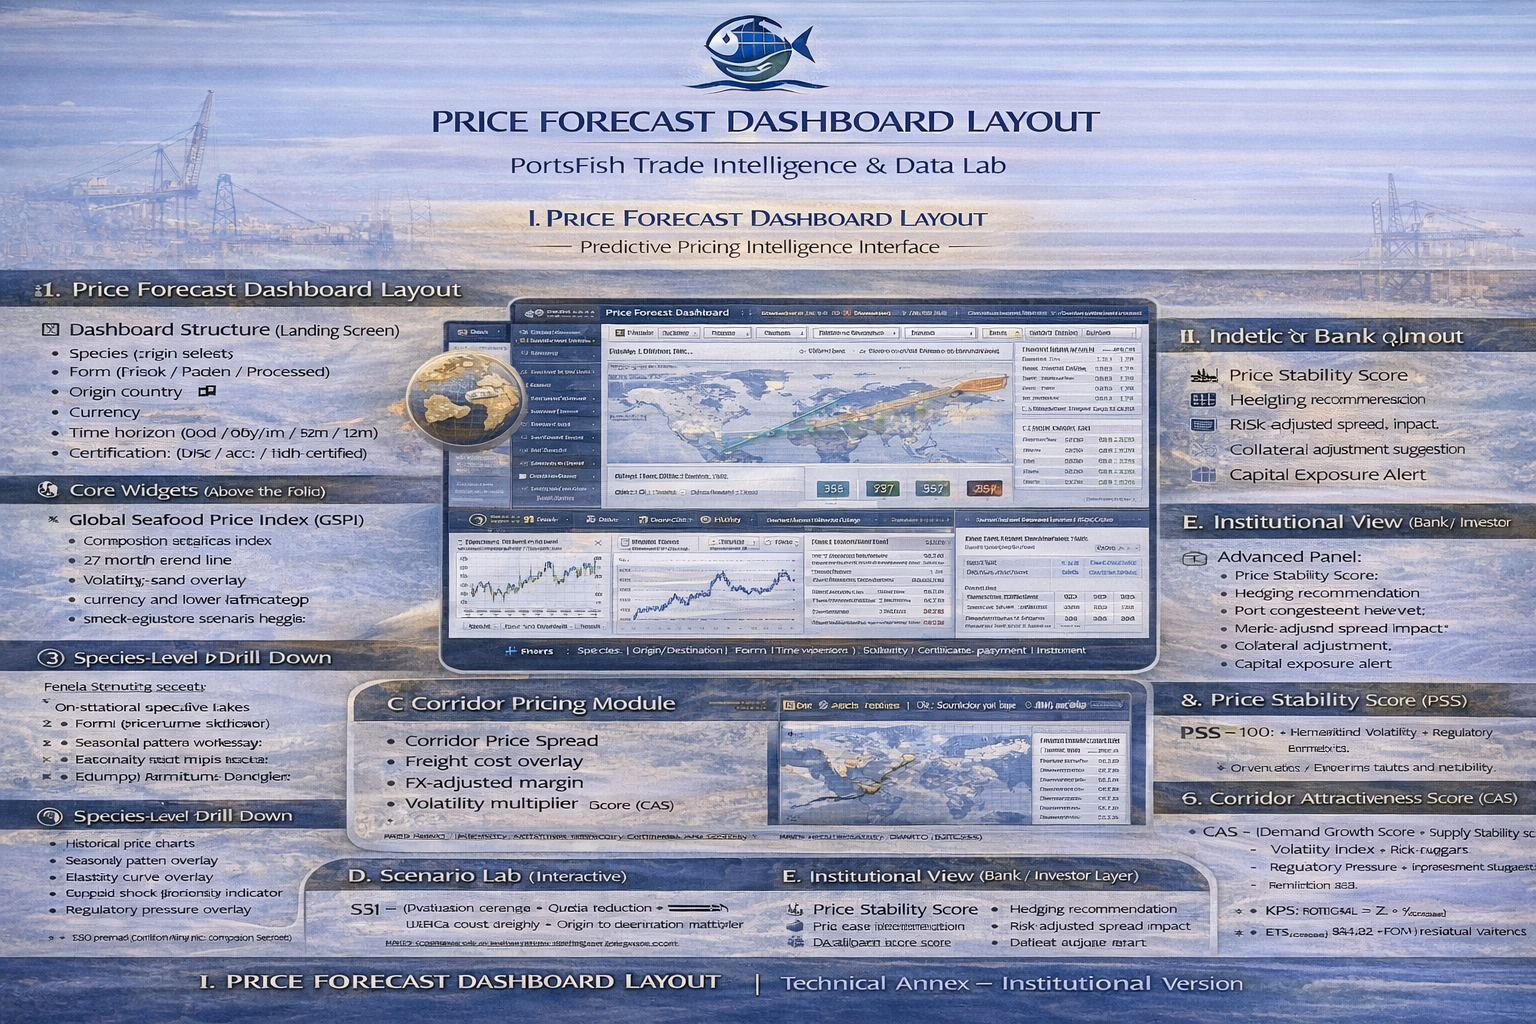
I. PRICE FORECAST DASHBOARD LAYOUT
PortsFish Trade Intelligence & Data Lab
Predictive Pricing Intelligence Interface
1️⃣ Dashboard Structure (Screen-by-Screen Layout)
A. Global Price Overview (Landing Screen)
Top Bar Filters
- Species (multi-select)
- Form (Fresh / Frozen / Processed)
- Origin country
- Destination market
- Currency
- Time horizon (30d / 90d / 6m / 12m)
- Certification (MSC / ASC / Non-certified)
- Incoterm
Core Widgets (Above the Fold)
- Global Seafood Price Index (GSPI)
- Composite weighted index
- 12-month trend line
- Volatility band overlay
- Forecast Curve
- Baseline projection
- Upper and lower confidence bands
- Shock-adjusted scenario toggle
- Volatility Gauge
- Current volatility percentile (vs 5-year history)
- Color-coded: Green / Amber / Red
- Margin Risk Indicator
- Corridor-specific margin compression probability
B. Species-Level Drill Down
Panels:
• Historical price chart (1Y / 3Y / 5Y)
• Seasonal pattern overlay
• Elasticity curve
• Supply shock sensitivity indicator
• Regulatory pressure overlay
Right Panel:
• Price Forecast Table (30d / 90d / 6m / 12m)
• Forecast confidence score
• FX impact sensitivity
C. Corridor Pricing Module
Map-based interface:
Origin → Destination
Metrics:
- Corridor Price Spread
- Freight cost overlay
- FX-adjusted margin
- Volatility multiplier
- Corridor Attractiveness Score (CAS)
D. Scenario Lab (Interactive)
User can toggle:
- Fuel +20%
- EU quota reduction
- Port congestion event
- Currency shock (±10%)
- Regulatory tightening
- Supply disruption event
System recalculates:
- Forecast curve
- Margin compression
- Volatility index
- Recommended payment instrument
E. Institutional View (Bank / Investor Layer)
Advanced Panel:
- Price Stability Score
- Hedging Recommendation
- Risk-adjusted spread impact
- Collateral adjustment suggestion
- Capital exposure alert
II. INDEX CALCULATION METHODOLOGY
Technical Annex – Institutional Version
1️⃣ Global Seafood Price Index (GSPI)
1.1 Index Structure
GSPI = Σ (Wi × Pi_adj)
Where:
Wi = weight of species i (based on global trade volume share)
Pi_adj = currency and corridor adjusted price of species i
Weights recalculated annually based on:
- Global trade volume
- Value-weighted trade flows
- Liquidity of market data
1.2 Currency Adjustment
Pi_adj = Pi_local × FX_normalization_factor
FX_normalization_factor adjusts all prices into USD baseline using rolling FX average.
2️⃣ Volatility Index (VI)
VI = σ(Pt − Pt-1) × √252
Where:
σ = standard deviation
252 = trading days annualization factor
Volatility percentile = current VI vs 5-year rolling distribution.
3️⃣ Forecasting Engine
Hybrid Model:
A. Time-Series Core
ARIMA / SARIMA (seasonal adjustment)
B. Exogenous Variables
Regression layer including:
- Fuel index (Brent)
- Freight index
- FX rate
- Regulatory pressure score
- Supply Shock Indicator (SSI)
Forecast:
Pt+1 = α + β1(Fuel) + β2(Freight) + β3(FX) + β4(Regulatory) + β5(SSI) + ARIMA_component
4️⃣ Supply Shock Indicator (SSI)
SSI = (Production variance + Quota reduction + Climate event weight) × Origin concentration multiplier
Scaled 0–100.
5️⃣ Regulatory Pressure Score (RPS)
RPS = (IUU enforcement intensity + SPS alert count + Anti-dumping exposure) weighted by destination market severity.
6️⃣ Margin Compression Probability (MCP)
MCP = f(Price Volatility, Freight % of price, FX deviation, Inventory pressure)
Logistic regression model outputs:
Probability (0–1) of margin falling below defined threshold.
7️⃣ Confidence Interval Calculation
CI = Forecast ± (Z × σ_forecast)
Z = 1.96 for 95% CI
σ_forecast derived from residual variance.
8️⃣ Price Stability Score (PSS)
PSS = 100 − (Normalized Volatility × Regulatory multiplier)
Higher score = lower structural instability.
9️⃣ Corridor Attractiveness Score (CAS)
CAS = (Demand Growth Score × Supply Stability Score)
− (Volatility Index × Risk Weight)
− (Regulatory Pressure × Enforcement Multiplier)
Normalized 0–100.
III. STRATEGIC VALUE
This system allows:
• Banks to adjust LC confirmation thresholds
• Exporters to time contracts
• Importers to hedge properly
• Investors to allocate capital based on volatility-adjusted yield
• Ports to anticipate volume shifts
This is not a price chart.
It is a pricing intelligence engine embedded inside a trade infrastructure system.