

PortsFish.Agency | Trade Intelligence & Data Lab
Strategic Market Intelligence Layer
Supply–Demand Analytics at PortsFish.Agency is a structured quantitative and strategic intelligence framework designed to map, forecast, and optimize global seafood trade flows by analyzing production capacity, consumption patterns, regulatory constraints, and price elasticity across key markets.
In international seafood trade, imbalance between supply and demand determines pricing power, risk exposure, corridor shifts, and capital efficiency.
PortsFish converts supply-demand volatility into actionable intelligence for exporters, importers, ports, and institutional investors.
Strategic Function
Supply–Demand Analytics operates as a predictive engine within the PortsFish ecosystem, supporting:
- Market Entry Programs
- Trade Finance Structuring
- Cross-Border Risk Management
- Global Seafood Market Reports
- Institutional Investor Intelligence
It transforms market noise into strategic positioning signals.
1. Global Production Mapping
We analyze:
- Wild catch volumes by region
- Aquaculture production growth rates
- Species-specific output concentration
- Seasonal harvesting cycles
- Climate-related production variability
- Regulatory-driven supply restrictions
This enables early detection of:
- Supply compression events
- Overproduction cycles
- Regulatory-driven export restrictions
- Climate disruption impact
2. Consumption & Demand Modeling
Demand-side analytics include:
- Per capita seafood consumption by region
- Retail vs food service consumption split
- Premiumization trends
- Health-driven dietary shifts
- Institutional procurement policies
- Population growth correlation
Markets analyzed include:
- United States
- European Union
- GCC
- China
- Japan
- Southeast Asia
- Emerging protein markets
3. Price Elasticity & Margin Analysis
Supply-demand imbalance directly impacts pricing structure.
We model:
- Historical species price elasticity
- Substitution effects (e.g., shrimp vs whitefish)
- Wholesale-retail margin spreads
- Currency-adjusted demand sensitivity
- Fuel & freight cost pass-through
This supports contract negotiation and risk-adjusted pricing.
4. Corridor Imbalance Detection
Using trade flow data, we identify:
- Under-supplied high-demand corridors
- Over-saturated export routes
- Emerging demand clusters
- Alternative routing opportunities
This intelligence feeds directly into Market Entry Programs and Trade Corridor Activation strategies.
5. Regulatory Supply Constraints
Supply is increasingly shaped by regulatory enforcement.
We monitor:
- IUU enforcement tightening
- Fishing quotas
- Environmental restrictions
- Sustainability certification requirements
- Trade embargoes and tariff impacts
Regulatory pressure often creates artificial scarcity — generating pricing opportunities.
6. Inventory & Stock Level Indicators
Where available, we assess:
- Cold storage inventory levels
- Port warehouse capacity
- Import buffer stocks
- Seasonal build-up cycles
Inventory data helps anticipate:
- Price spikes
- Import slowdowns
- Short-term demand shocks
7. Forward-Looking Forecast Models
Supply–Demand Analytics includes predictive modeling:
- 6-month forecast windows
- 12-month corridor projections
- Regulatory tightening scenarios
- Climate-adjusted production models
- FX-adjusted demand sensitivity
This supports capital deployment decisions.
8. Investor-Focused Demand Signals
For institutional clients, we provide:
- Species-level growth outlook
- High-margin corridor identification
- Risk-adjusted demand score
- ESG-driven demand premium analysis
- Infrastructure bottleneck opportunities
This aligns seafood trade with structured capital strategy.
9. Risk-Adjusted Opportunity Index (Supply–Demand Layer)
Each market and species combination receives:
- Supply Stability Score
- Demand Growth Score
- Regulatory Pressure Score
- Volatility Index
- Capital Attractiveness Rating
This creates a structured comparative framework.
10. Integration with Risk & Finance Systems
Supply–Demand Analytics feeds into:
- Customs Risk Scoring Model (CRSM)
- International Payment Risk Scoring Matrix (IPRSM)
- Cross-Border Risk Index (CBRI)
- Trade Finance Structuring
Market imbalance signals directly influence:
- Payment mechanism selection
- LC structuring
- Insurance coverage requirements
- Margin allocation strategy
Strategic Outcome
Supply–Demand Analytics transforms seafood trade from reactive exporting into intelligence-led corridor positioning.
The objective is:
• Predict price movement
• Anticipate supply compression
• Identify growth corridors
• Reduce volatility exposure
• Optimize capital allocation
• Strengthen negotiation power
PortsFish ensures that market expansion is driven by structured supply-demand intelligence — not intuition.
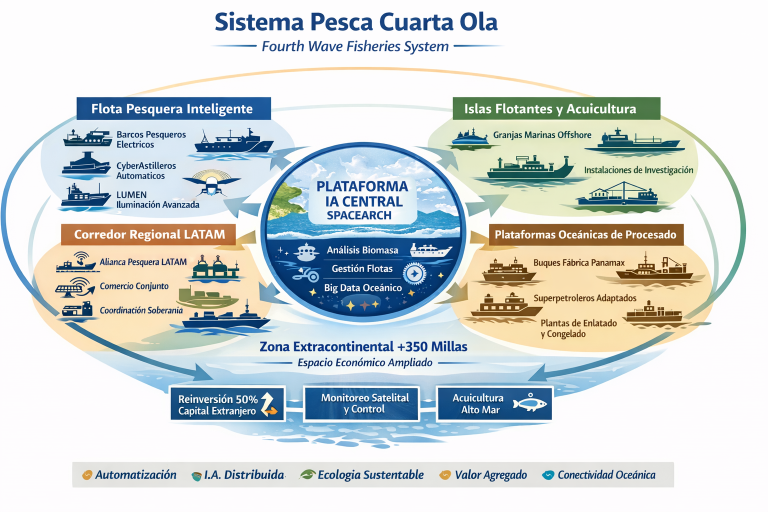
Supply–Demand Dashboard Architecture
PortsFish.Agency | Trade Intelligence & Data Lab
Premium Intelligence Module
1) Purpose
To provide a real-time and forecast-ready view of global seafood supply, demand, price volatility, and trade corridor imbalances, enabling:
- Market entry decisions (USA / EU / GCC / Asia)
- Contract pricing & hedging strategy
- Trade finance structuring (LC type, insurance triggers)
- Corridor activation and port selection
- Investor-level risk-adjusted opportunity screening
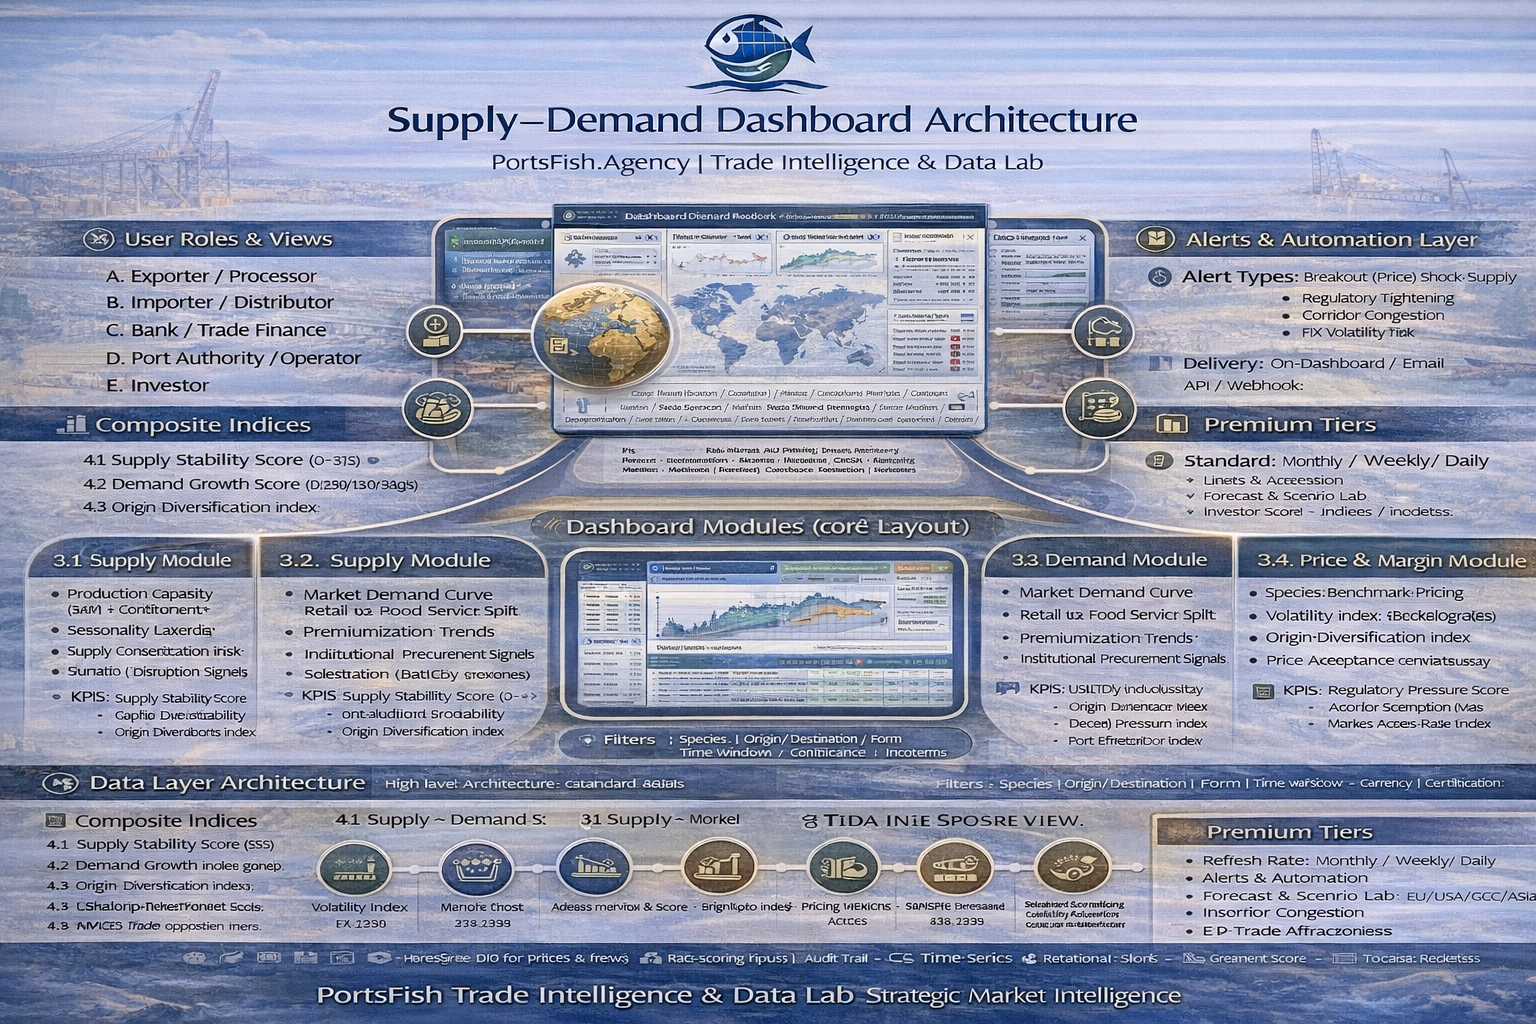
2) User Roles & Views
A. Exporter / Processor View
- Demand hotspots + price windows
- Corridor recommendations
- Buyer-market readiness indicators
B. Importer / Distributor View
- Supply stability and availability outlook
- Lead-time risk + inventory pressure
- Alternative sourcing corridors
C. Bank / Trade Finance View
- Volatility + regulatory pressure overlays
- Risk scoring inputs (CRSM/IPRSM/CBRI)
- Settlement risk vs corridor reliability
D. Port Authority / Operator View
- Volume forecasts by lane
- Reefer + cold storage capacity pressure
- Congestion and clearance risk correlation
E. Investor View
- Risk-Adjusted Opportunity Index (RAOI)
- Corridor attractiveness ranking
- ESG premium signals + infrastructure bottlenecks
3) Dashboard Modules (Core Layout)
3.1 Global Overview (Landing)
Widgets:
- Global Supply Index (by species)
- Global Demand Growth Index (by market)
- Price Volatility Heatmap
- Corridor Imbalance Map (Supply vs Demand)
- “Top 10 Opportunities” + “Top 10 Risks” list
Filters:
Species | Form (fresh/frozen/processed) | Region | Time window | Currency | Certification (MSC/ASC) | Incoterms
3.2 Supply Module
Key Panels:
- Production Capacity (wild / aquaculture)
- Seasonality Calendar
- Supply Concentration Risk (top origins %)
- Climate / disruption signals
- Regulatory constraints (quotas, closures)
KPIs:
- Supply Stability Score (0–100)
- Supply Shock Probability (30/90/180 days)
- Origin Diversification Index
3.3 Demand Module
Key Panels:
- Market demand curve by region
- Retail vs food service split
- Premiumization trend indicators
- Institutional procurement signals
- Substitution elasticity (cross-species)
KPIs:
- Demand Growth Score (0–100)
- Demand Pressure Index
- Price Acceptance Band (elasticity)
3.4 Price & Margin Module
Key Panels:
- Species benchmark pricing (multi-market)
- Price bands (1y / 3y / 5y)
- Freight + fuel cost overlay
- FX-adjusted pricing
- Margin waterfall (origin → wholesale → retail)
KPIs:
- Volatility Index
- Margin Compression Risk
- Pricing Window Alerts
3.5 Trade Corridor Module
Key Panels:
- Corridor flow map (origin → destination)
- Port node performance overlay
- Lead time distribution + delay risk
- Cold chain readiness score by corridor
- Alternative corridor recommendations
KPIs:
- Corridor Attractiveness Score
- Corridor Disruption Risk
- Port Efficiency Index
3.6 Regulatory & ESG Overlay
Key Panels:
- IUU enforcement intensity map
- SPS tightening alerts
- Anti-dumping/trade remedy watchlist
- Certification adoption rates
- ESG premium price delta tracking
KPIs:
- Regulatory Pressure Score
- ESG Eligibility Score
- Market Access Risk Index
3.7 Forecast & Scenario Lab
Capabilities:
- 6/12-month demand forecasts
- Scenario toggles:
- “Fuel up +20%”
- “EU enforcement tightening”
- “Currency shock”
- “Port congestion spike”
- “Quota reduction”
- Probability bands and confidence intervals
Outputs:
- Forecast tables + chart layers
- Corridor shifts predicted
- Recommended action set (export strategy / pricing / finance)
4) Composite Indices (Scoring Engine)
4.1 Supply Stability Score (SSS)
Inputs: production variance, concentration risk, seasonality, regulatory constraints, climate events
4.2 Demand Growth Score (DGS)
Inputs: consumption trends, channel mix, income indicators, substitution elasticity, procurement signals
4.3 Volatility Index (VI)
Inputs: historical price bands, FX, freight/fuel correlation, inventory buffers
4.4 Corridor Attractiveness Score (CAS)
Inputs: SSS + DGS + VI + port performance + lead-time risk
4.5 Risk-Adjusted Opportunity Index (RAOI)
CAS adjusted by:
- CRSM (customs risk)
- IPRSM (payment risk)
- CBRI (cross-border risk)
- ESG score
5) Alerts & Automation Layer
Alert Types:
- Price breakout alerts (species/market)
- Supply shock alerts (origin disruption)
- Regulatory tightening alerts (EU/USA/GCC/Asia)
- Corridor congestion alerts
- FX volatility alerts
- “Buy window / Sell window” signals (advisory)
Delivery:
Dashboard + email summary + API webhook (optional)
6) Data Layer Architecture (High-Level)
6.1 Data Sources (examples)
- Trade flow datasets (imports/exports by HS/species)
- Port performance / congestion feeds
- Wholesale benchmark price feeds
- FX rates + fuel indexes
- Regulatory bulletins (IUU/SPS/customs updates)
- Certification registries (MSC/ASC)
- Internal PortsFish corridor performance logs
6.2 Processing
- ETL pipelines + normalization
- Species taxonomy mapping
- HS code harmonization
- Confidence scoring per datapoint
- Audit trail for investor-grade reporting
6.3 Storage
- Time-series DB for prices and flows
- Document store for regulatory bulletins
- Relational DB for entities (ports, buyers, suppliers)
7) UX Principles (Investor-Grade)
- Simple “Global Overview” entry point
- Drill-down by corridor/species/market
- Explainable indices (click to see drivers)
- Exportable charts + PDF snapshot
- “Decision Summary” panel (what to do now)
8) Premium Tiers (Optional)
Standard Analytics
- Overview + basic filters + monthly refresh
Professional
- Corridor module + alerts + weekly refresh
Institutional / Investor
- Scenario Lab + RAOI + bank view + API access + quarterly deep reports