


PortsFish.Agency | Trade Intelligence & Data Lab
Climate Risk & Sustainability Intelligence Layer
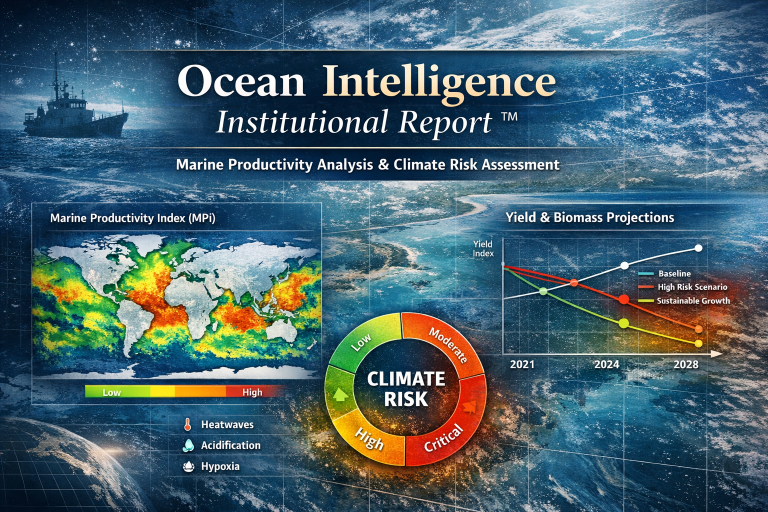
Climate & Fishing Impact Intelligence is a structured analytical framework designed to assess how climate variability, oceanographic shifts, environmental regulation, and ecosystem stress directly impact seafood supply stability, trade corridors, price volatility, and long-term capital exposure.
In modern seafood trade, climate risk is no longer environmental — it is financial.
PortsFish integrates climate intelligence into trade decision-making.
Strategic Role Within PortsFish
This module connects:
- Supply Stability
- Price Forecasting
- Regulatory Risk
- ESG Capital Flows
- Trade Finance Structuring
- Long-Term Infrastructure Investment
It transforms environmental uncertainty into structured commercial foresight.
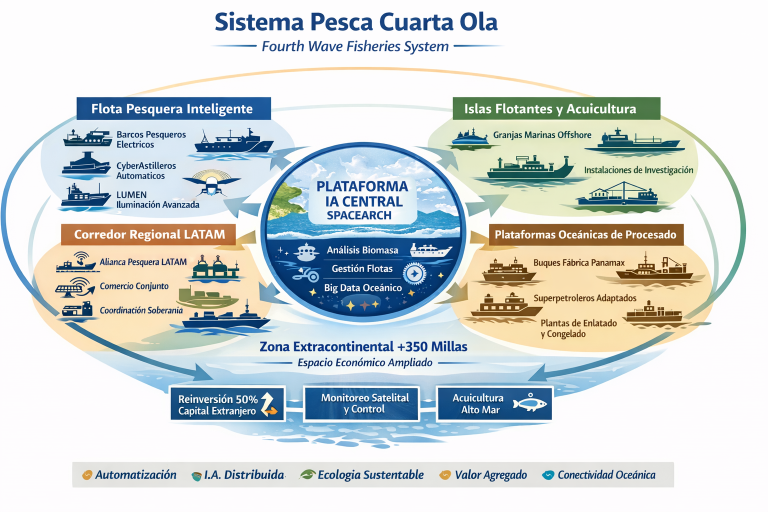
1️⃣ Oceanographic & Climate Monitoring Layer
We track and model:
- Sea surface temperature anomalies
- El Niño / La Niña cycles
- Ocean acidification trends
- Marine heatwaves
- Storm frequency & intensity
- Coral bleaching events
- Hypoxia zones (oxygen depletion)
These variables directly influence:
- Migration patterns
- Catch volume volatility
- Aquaculture mortality rates
- Seasonal production shifts
2️⃣ Wild Catch & Aquaculture Vulnerability Index
We assess:
- Species-specific climate sensitivity
- Geographic concentration risk
- Feed input dependency (for aquaculture)
- Freshwater stress exposure
- Disease outbreak probability
Output:
Fishing Impact Vulnerability Score (FIVS)
Scaled 0–100.
Higher score = higher climate exposure risk.
3️⃣ Regulatory Climate Pressure Monitoring
Climate impacts regulatory behavior.
We monitor:
- Fishing quota reductions
- Marine protected area expansions
- Carbon footprint reporting mandates
- Sustainable sourcing requirements
- Anti-IUU enforcement tightening
- Import bans linked to environmental compliance
This feeds directly into:
- Regulatory Pressure Score (RPS)
- Market Access Risk Index
4️⃣ Production Disruption Forecasting
Using climate models and production data, we simulate:
- 6-month production variability
- Seasonal disruption probabilities
- Long-term structural yield decline
- Aquaculture yield compression under warming scenarios
This integrates with:
- Supply Shock Indicator (SSI)
- Price Forecasting Engine
5️⃣ Climate-Driven Price Elasticity Modeling
Climate shocks affect pricing via:
- Sudden supply compression
- Regulatory restrictions
- Insurance cost escalation
- Fuel price spikes (storm-related logistics disruption)
PortsFish models:
- Climate-Adjusted Price Impact Coefficient (CAPIC)
- Volatility amplification multiplier
- Margin compression probability under climate scenarios
6️⃣ ESG & Capital Exposure Layer
Institutional investors increasingly require:
- Climate risk disclosure
- Supply chain traceability
- Carbon reporting
- Sustainable sourcing verification
PortsFish provides:
- ESG Compliance Readiness Score
- Climate Exposure Transparency Index
- Certification adoption growth metrics
- Climate-adjusted capital risk rating
This supports:
- Green bond structuring
- ESG trade finance products
- Sustainability-linked credit facilities
7️⃣ Corridor-Level Climate Risk Mapping
We evaluate:
- Climate vulnerability by fishing region
- Port infrastructure climate exposure
- Cold chain resilience index
- Storm disruption probability
- Insurance premium escalation risk
This produces:
Climate-Adjusted Corridor Attractiveness Score (CACAS)
Used by:
- Exporters
- Banks
- Maritime insurers
- Infrastructure investors
8️⃣ Long-Term Structural Risk Modeling
We analyze:
- Biomass decline trends
- Species migration shifts
- Regional fishery collapse probability
- Aquaculture expansion feasibility zones
- Alternative protein substitution risk
This allows early repositioning of trade corridors.
9️⃣ Scenario Simulation Lab
Users can simulate:
- 2°C ocean warming impact
- Major El Niño event
- Quota tightening scenario
- Marine protected area expansion
- Extreme storm season
- Disease outbreak in aquaculture
System recalculates:
- Supply Stability Score
- Price Forecast
- Regulatory Risk
- Margin compression
- Trade Finance structuring adjustments
🔟 Strategic Outcome
Climate & Fishing Impact Intelligence enables:
• Anticipation of supply compression
• Climate-adjusted pricing strategy
• Regulatory preparedness
• ESG-aligned capital positioning
• Insurance optimization
• Corridor diversification
It transforms environmental volatility into structured strategic advantage.
Institutional Positioning Statement
PortsFish integrates climate intelligence directly into seafood trade infrastructure.
This is not environmental reporting.
It is climate-adjusted trade strategy.
Technical Annex: Fishing Impact Vulnerability Score (FIVS)
PortsFish Trade Intelligence & Data Lab
1. Purpose
The Fishing Impact Vulnerability Score (FIVS) quantifies the climate-and-ecosystem exposure of seafood supply (wild catch and aquaculture) by species, origin geography, and production system.
It is designed to support:
- Supply–Demand Analytics
- Price Index & Forecasting
- Cross-Border Risk Management
- ESG underwriting and disclosure
- Trade finance covenanting (LC/insurance triggers)
- Corridor diversification strategy
Output: A normalized 0–100 score
- 0–30 = Low vulnerability
- 31–60 = Moderate vulnerability
- 61–80 = High vulnerability
- 81–100 = Critical vulnerability
2. Scope and Unit of Analysis
FIVS is computed for a defined (Species × Origin Region × Production Mode) tuple, where:
- Species = commercial species or species group (e.g., shrimp L. vannamei, tuna skipjack)
- Origin region = FAO fishing area / EEZ / coastal production zone (or aquaculture region)
- Production mode = Wild Catch / Aquaculture (pond, cage, RAS, etc.)
3. Model Architecture (High-Level)
FIVS is a weighted composite of five risk pillars:
- Ocean–Climate Hazard Exposure (H)
- Biological Sensitivity (S)
- Origin Concentration & Mobility Risk (C)
- Operational & Infrastructure Fragility (O)
- Governance & Adaptation Capacity (G) (inverse factor)
Core formula
FIVS=100×(wH⋅H+wS⋅S+wC⋅C+wO⋅O+wG⋅(1−G))
Where each component is normalized to [0,1] and weights sum to 1.
Recommended baseline weights (seafood trade use-case):
- wH=0.30
- wS=0.20
- wC=0.15
- wO=0.20
- wG=0.15
(Weights may be calibrated by species class or by investor/bank risk appetite.)
4. Component Definitions (Normalized Sub-Indices)
4.1 Ocean–Climate Hazard Exposure (H) ∈ [0,1]
Measures the intensity and frequency of climate/ocean hazards affecting the origin region.H=α1⋅SSTA+α2⋅MHW+α3⋅ACID+α4⋅HYPOX+α5⋅STORM
Where:
- SSTA = Sea Surface Temperature Anomaly index
- MHW = Marine Heatwave frequency/severity index
- ACID = Ocean acidification trend index (proxy)
- HYPOX = Hypoxia/low-oxygen event index
- STORM = storm/cyclone disruption index
Weights αi sum to 1. Recommended:
- α1=0.25, α2=0.25, α3=0.15, α4=0.15, α5=0.20
Normalization: each hazard indicator is scaled using a rolling historical distribution for the region (e.g., min–max with winsorization or percentile rank mapped to [0,1]).
4.2 Biological Sensitivity (S) ∈ [0,1]
Measures species susceptibility to climate stressors and ecological change.S=β1⋅TOL+β2⋅REPRO+β3⋅DISEASE+β4⋅HABITAT
Where:
- TOL = thermal tolerance risk (inverse of tolerance range)
- REPRO = reproductive fragility (slow growth / late maturity risk)
- DISEASE = disease susceptibility (especially aquaculture)
- HABITAT = dependence on vulnerable habitats (reefs, mangroves, nursery grounds)
Recommended weights:
- β1=0.35, β2=0.20, β3=0.25, β4=0.20
Note: For aquaculture species, DISEASE and HABITAT may carry higher weights.
4.3 Origin Concentration & Mobility Risk (C) ∈ [0,1]
Captures exposure arising from geographic concentration and limited substitution.C=γ1⋅CONC+γ2⋅SUBST+γ3⋅MIG
Where:
- CONC = origin concentration (Herfindahl-Hirschman Index mapped to [0,1])
- SUBST = substitutability deficit (low availability of alternative origins/species)
- MIG = migration volatility risk (wild catch only; set MIG=0 for aquaculture)
Recommended weights:
- γ1=0.50, γ2=0.30, γ3=0.20
4.4 Operational & Infrastructure Fragility (O) ∈ [0,1]
Measures how operational systems amplify climate shock impacts.O=δ1⋅CC+δ2⋅PORT+δ3⋅ENERGY+δ4⋅WATER+δ5⋅INS
Where:
- CC = cold chain fragility index (temperature control reliability, redundancy)
- PORT = port/logistics disruption index (congestion, storm exposure, clearance delays)
- ENERGY = power reliability risk (critical for cold storage/processing)
- WATER = freshwater stress risk (aquaculture-heavy regions)
- INS = insurance cost escalation proxy (or claim frequency proxy)
Recommended weights:
- δ1=0.25, δ2=0.25, δ3=0.20, δ4=0.15, δ5=0.15
4.5 Governance & Adaptation Capacity (G) ∈ [0,1]
Represents mitigants: institutional capacity to manage fisheries sustainably and adapt.G=θ1⋅MGMT+θ2⋅ENF+θ3⋅DATA+θ4⋅INFRA+θ5⋅CERT
Where:
- MGMT = fisheries management strength (quota design, stock assessment rigor)
- ENF = enforcement capacity (IUU control effectiveness)
- DATA = data transparency (monitoring, traceability readiness)
- INFRA = adaptive infrastructure investment (resilience measures)
- CERT = certification & compliance penetration (MSC/ASC adoption proxy)
Recommended weights:
- θ1=0.25, θ2=0.25, θ3=0.15, θ4=0.20, θ5=0.15
Because higher governance reduces vulnerability, the main formula uses (1 − G).
5. Production Mode Adjustments
5.1 Wild Catch Modifier
Wild catch is highly exposed to migration and ecosystem shifts:FIVSwild=FIVS×(1+λwild⋅MIG_AMP)
Where MIG_AMP∈[0,1] captures species migration volatility intensity.
Recommended λwild=0.10.
5.2 Aquaculture Modifier
Aquaculture is sensitive to disease + water + feed dependency:FIVSaqua=FIVS×(1+λaqua⋅DISEASE_AMP+μ⋅WATER)
Recommended λaqua=0.10, μ=0.05, capped so final remains ≤100 via winsorization.
6. Calibration & Normalization Rules
6.1 Normalization
All indicators must be mapped into [0,1] using one of:
- Percentile rank normalization (preferred for robustness)
- Winsorized min–max scaling (p5–p95 range)
6.2 Data Confidence Score (optional overlay)
Each FIVS value may carry a Data Confidence Level (DCL):DCL=min(1, coverage×recency×source_quality)
Reported alongside FIVS for investor-grade transparency.
7. Output Reporting Format
For each tuple (species × origin × mode), the report provides:
- FIVS score (0–100)
- Pillar breakdown: H, S, C, O, G
- Top drivers (ranked)
- Confidence band (High/Med/Low)
- Recommended actions:
- corridor diversification
- insurance / LC confirmation triggers
- resilience investments (cold chain / port)
- certification and governance upgrades
8. Governance Threshold Triggers (Practical Use)
Suggested policy triggers:
- FIVS ≥ 70: mandatory enhanced monitoring + contingency routing
- FIVS ≥ 80: mandatory insurance layer + confirmed LC preference
- FIVS ≥ 85: executive risk committee review for corridor dependence